We all want a cool flashy Dashboard right?
You have seen your mates, or one of the amazing ones on Reddit’s /r/homelab and now you want one yourself.
Be warned, it’s not a simple point and click, make sure you know how to use a text editor!
This is a step by step guide on how I got mine to work, as I tried MANY times, and failed,
but that’s how you learn!

PART ONE: The Base Install
—
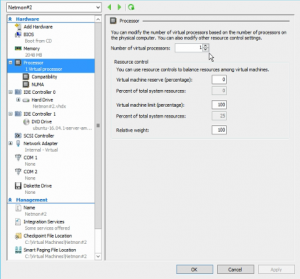
Install a Virtual Machine somewhere,
I’m using Hyper-V,
I used 2048MB RAM, 127GB HDD 4 CPU
It will work on all flavors of Linux, I have used Centos 7 previously at work,
However, in this example we will use Ubuntu 16.04
Set the time zone, Keyboard, Partitioning, Network info (CentOs) in the OS setup.
Make sure you enable Open SSH in the install, no stress if you forget, we will do it later.
Let the installer finish and you should have a base system.
Reboot into your new server and do the updates:
#Sudo apt-get update
#Sudo apt_get upgrade
#Sudo apt-get dist-upgrade
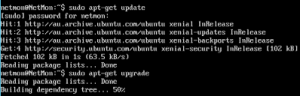
Wait for that to finish.
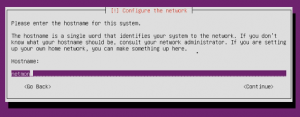
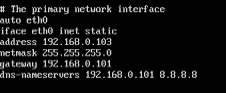
Now its time to setup a Static IP Address on this VM.
#Sudo nano /etc/network/interfaces
Change it to suit your network:
iface eth0 inet static
address 192.168.0.103
netmask 255.255.255.0
gateway 192.168.0.101
dns-nameservers 8.8.8.8 8.8.4.4
Write that file, and issue:
#Service networking restart
Or, reboot. Whatever floats your boat…..
After reboot of service or VM, ping google.com, or another internet address to ensure that your network is all running properly!
![]()
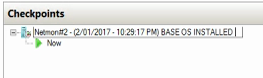
If you are accident prone, know you will bugger something up like me, or just feel like a refresh, you would be wise to add a VM snapshot now.
Login to your server again and installSSH if you didn’t do it in the installation:
#sudo apt-get install openssh-server
Generate the RSA Key
#ssh-keygen -t rsa
SSH to the server and make sure that is all working!
We will do the rest now from putty as its much easier than working on the VM directly
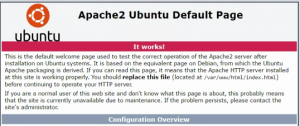
Lets Install apache!
#Sudo apt-get install apache2
Let it do its thing…..
On finished, jump into a web browser and check that it is defiantly working
Then jump onto Influx’s Website and grab the latest installer link.
Follow their guide on how to install the latest version,
Copy and paste at time of writing.
Run these 3 commands:
#curl -sL https://repos.influxdata.com/influxdb.key | sudo apt-key add –
#source /etc/lsb-release
#echo “deb https://repos.influxdata.com/${DISTRIB_ID,,} ${DISTRIB_CODENAME} stable” | sudo tee /etc/apt/sources.list.d/influxdb.list
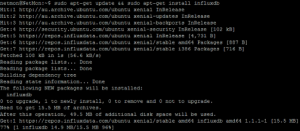
Then install and start the service:
#sudo apt-get update && sudo apt-get install influxdb
#sudo systemctl start influxdb
You can verify it is installed after everything has finished running by running
Influx at the command prompt, you should receive the following
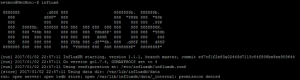
netmon@NetMon:~$ influx
 Visit https://enterprise.influxdata.com to register for updates, InfluxDB server management, and monitoring.
 Connected to http://localhost:8086 version 1.1.1
 InfluxDB shell version: 1.1.1
 >
If you need to, or are feeling ballsy, you can disable the firewall by: # sudo ufw disable
We need to enable the influx admin interface:
(Yeah its insecure, but this is a simple guide mate, at work you wouldn’t enable this! Use common sense!)
Nano that Bad boy by typing:
#Sudo nano /etc/influxdb/influxdb.conf
Head down to the lines:
[Admin]
UnComment and get it looking like this:
[admin]
# Determines whether the admin service is enabled.
enabled = true
# The default bind address used by the admin service.
bind-address = “:8083”
# Whether the admin service should use HTTPS.
# https-enabled = false
# The SSL certificate used when HTTPS is enabled.
# https-certificate = “/etc/ssl/influxdb.pem”
Then go to:
[HTTP]
And make it look like this:
[http]
# Determines whether HTTP endpoint is enabled.
enabled = true
# The bind address used by the HTTP service.
bind-address = “:8086”
# Determines whether HTTP authentication is enabled.
# auth-enabled = false
.…
# The path of the unix domain socket.
# bind-socket = “/var/run/influxdb.sock”
Leave the rest of it for the time being, make only the changes above to these files
DO NOT do the collectd settings at this point, it can cause it to crash.
We will run a few simple tests before enableing collectd.
Restart the service:
# Sudo systemctl restart influxdb
Head over to your servers ip:8083 you should see the following:

If you see this you are doing well!
Now it’s time to install Collectd
# sudo apt-get install collectd collectd-utils
# sudo apt-get install snmp-mibs-downloader
Go back to that influxdb.conf located at /etc/influxdb/influxdb.conf and uncomment the [Collectd] lines
Make it look like this
[[collectd]]
enabled = true
bind-address = “:25826”
database = “collectd”
# retention-policy = “”
# typesdb = “/usr/share/collectd/types.db”
…
# UDP Read buffer size, 0 means OS default. UDP listener will fail if set above OS max.
# read-buffer = 0
Restart the service:
# Sudo systemctl restart influxdb
Go back to the Influx admin Webpage <SERVER IP>:8083
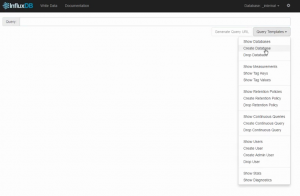
We now need to create a new database for collectd to store information in.
Select Query Templates on the right hand side.
The Query line will now show something similar to: CREATE DATABSE “Collectd”
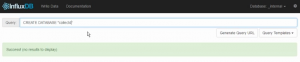
Remember to add “collectd” in there to create the database.
Just press enter, and the green bar should say ‘Success!’
Now we need to configure Collectd to send Influx some data.
Edit the config file:
sudio nano et/collect/collectd.conf
Uncomment and Change Host name (if you want)
Make sure ‘network’ is uncommneted and that CPU and a few others are uncommented out.
This is the plugin that we need to use.
Additionally, by default the following should be uncommented (enabled) also:
LoadPlugin battery
LoadPlugin cpu
LoadPlugin df
LoadPlugin disk
LoadPlugin entropy
LoadPlugin interface
LoadPlugin irq
LoadPlugin load
LoadPlugin memory
LoadPlugin network
LoadPlugin processes
LoadPlugin rrdtool
LoadPlugin swap
LoadPlugin users
All of these plugins relate to the HOST. You can find the plugin variables later on down in the config file.
However, we only need to focus on network.
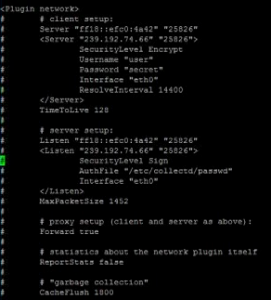
Uncomment the network plugin so that it looks like below:
<Plugin network>
# # client setup:
# Server “ff18::efc0:4a42” “25826”
Server “127.0.0.1” “25826”
# SecurityLevel Encrypt
# Username “user”
# Password “secret”
# Interface “eth0”
# ResolveInterval 14400
# </Server>
# TimeToLive 128
#
# # server setup:
# Listen “ff18::efc0:4a42” “25826”
# <Listen “239.192.74.66” “25826”>
# SecurityLevel Sign
# AuthFile “/etc/collectd/passwd”
# Interface “eth0”
# </Listen>
# MaxPacketSize 1452
#
# # proxy setup (client and server as above):
# Forward true
#
# # statistics about the network plugin itself
# ReportStats false
#
# # “garbage collection”
# CacheFlush 1800
</Plugin>
Its a bit like a HTML Tag, just focus on setting 127.0.0.1 as the server IP address.
Restart the Collectd service
# Sudo systemctl restart collectd
Verify that it is running correctly:
# Sudo systemctl status collectd
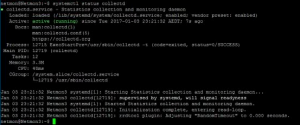
Lets check that we have some data being written to our Influxdb go back to the influx webpage and click,
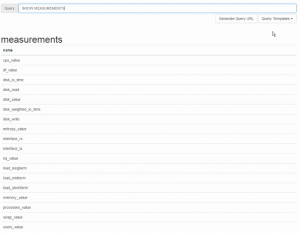
Query Templates –> Show Measurements –> Press Enter.
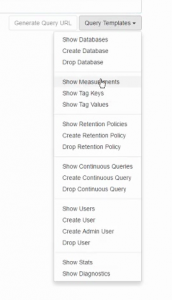
You should be able to see that some of those plugins are writing data to the database.
Now it’s finally time to install Grafana!
Just like before with Influx, follow the commands applicable to your distro as listed on the grafana’s installation guide on their website.
Here is a copy and paste at time of writing:
$ wget https://grafanarel.s3.amazonaws.com/builds/grafana_4.0.2-1481203731_amd64.deb

$ sudo apt-get install -y adduser libfontconfig

$ sudo dpkg -i grafana_4.0.2-1481203731_amd64.deb
Start the grafana server:
#systemctl start grafana-server
If you haven’t done so already, make sure all the services we require start at boot:
#systemctl enable grafana-server.service
#systemctl enable influxdb.service
#systemctl enable collectd.service
Snapshot / Checkpoint time!
There is nothing worse downloading these files over a crappy Australian Internet Link only to have to restart it all again if you bork it all up!
If your confident you are not going to mess things up, keep going!
Lets jump right into the Webconfig of Grafana!
<SERVER IP>:3000
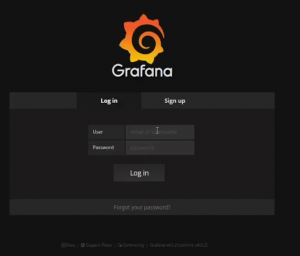
USR: admin
PW: admin
Now we need to tell Grafana where our data source is,
Click the Grafana logo in the top right hand corner and select Data Sources
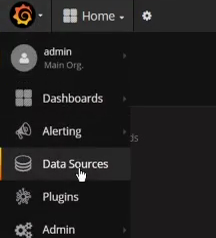
Click Add a Data source, that really big green button.
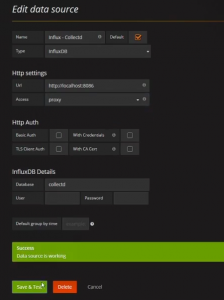
Give it a creative Name,
Default = Checked
Type = InfluxDB
URL= http://localhost:8086
Database = collectd
Here are my settings:
Go back to the main Grafana Home Page,
Click “home” and you should now be able to “Create New” Dashboard.
Click Graph, and click on the panel title.
Now we can setup the structure of the query, More info on that later,
Just have a play with the information that is in the DB and all the options that you have available.
See if you can get the CPU Usage, RAM Usage and hard drive space available on you VM.
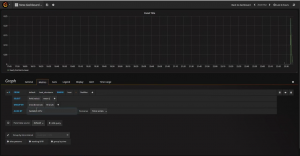
Its simple, but its working!
PART 2
To be continued…..
-SNMP
-Telegraf
-Drawing Graphs
-Speed Tester
-etc……
My working Config Files:
collectd
influxdb
Awesome tutorials very helpful…thanks